AIR POLLUTION IN LOS ANGELES
Location
The Primary location that this blog will focus on is in the City of Los Angeles. Over Time, Los Angeles has garnered a bad reputation as having one of the most visible effects of air pollution in the world. (Berg, Linda page 201). This visual effect has been ongoing since the 1940s and is attributed to a phenomenon known as photochemical smog (Berg, page 201). This visible layer of smog over Los Angeles is a result of the Nitrogen Oxides and Hydrocarbons from Automobile exhaust reacting with the oxygen in the atmosphere in combination with the Sun’s solar energy (Berg page 201-202). These chemical reactions take place multiple times a day and will continue to do so as long as there is a constant source of pollution from motor vehicles. Sadly, the effects of air pollution extends beyond the city of Los Angeles and exists in many parts across the globe including the San Joaquin Valley and Fairbanks, Alaska which will be discussed later in this blog post. The image below shows the amount of air pollution across Southern California. This darker parts of the map indicate areas with more pollution (in ppm) than others. Three zip codes in Los Angeles alone are among the top 10 most polluted in the entire state of California. ( California Pollution Map via scpr.org). 
The Biome of the Los Angeles Basin
The biome of the Los Angeles River Basin, and the city of Los Angeles itself, can be classified as a Mediterranean Biome (Davis, Mike). These Biomes typically have the characteristics that you would see in regions around the Mediterranean Sea. Such characteristics of these regions include warm dry summers and wet winters. In fact, these types of environments are so rare, that they only occupy 3 percent to five percent of all the land available on the Earth (Davis, page 12). Unlike most Mediterranean climates, Los Angeles does not follow a typical year-round climate with changing seasons.Instead, the city of Los Angeles, “tends to exhibit 7-12 year long swings of dry and wet spells” (Davis, page 16). While the climate of Los Angeles follows a repeated cycle, the city of Los Angeles has grown exponentially in size and population. As the amount of people continues to grow in Los Angeles, the amount of pollution will inevitably increase as well.

History
Since the beginning of the Industrial revolution, Los Angeles began accelerating its industrialization. Factories had been heavily built in this area; people immigrants into this area from all over the world. The economy, technology, culture, population had gone through a quick growth. However, the bad things are yet to come. Factories immoderately output tens of black smog into the air; registered vehicles, particularly at 40s of the 20th century had developed into more than 2 millions runs on the road in Los Angeles area, and for more, this numbers have doubled in less than a decade, which means that the output of tail gases also have been doubled; products been produced and been consume in frequently because of the large population, leads industry to produce more, and more and more harmful gases have been blow into the air. Finally become a bad cycle, which can worsen the quality of the air in the Los Angeles area through decades.The chart and graph below shows the growth in Registered Vehicles:
Years
|
Registered Vehicles
(in millions)
|
1930
|
2
|
1940
|
2.8
|
1950
|
4.5
|
1960
|
8
|
1970
|
12
|
1980
|
17
|
1990
|
23
|
2000
|
23.4
|
Data coming from California’s Air Report Board, January 06, 2015, http://www.arb.ca.gov/html/brochure/history.htm
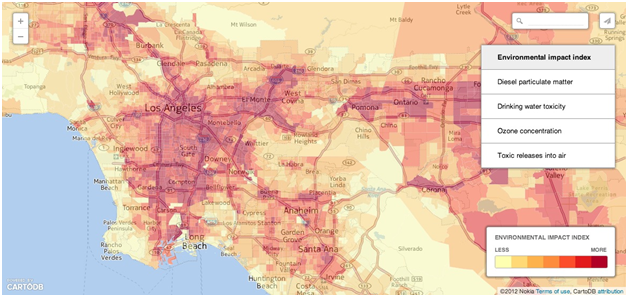
Another reason causes the air pollution in Los Angeles area is that Los Angeles is a natural pollution trap. As the picture showed below, Los Angeles is surrounding with mountains, and those mountains combine with temperature inversion to dirty area. This means that all the smokes, harmful gases, fumes from steel and chemical plants cannot escape outside the Los Angeles area.
Picture coming from Los Angeles Times, Pollution Burden, April 25, 2014,http://graphics.latimes.com/responsivemap-pollution-burdens/
Temperature Inversion is an abnormal air circulation pattern that follows with cold air at the bottom and warm air at its top. Through the normal case, air usually from warm to cool through a vertical view, so that air rise up from warm air to the cold air and can help disperse the pollutions. However, under the inversion case, air cannot go through from cool air to the warm air, so that pollutions nowhere to escape but store at the city. This kind of temperature inversion usually happened at valley or coastal areas. Unfortunately, Los Angeles is such a place. The picture below shows how temperature inversion works.
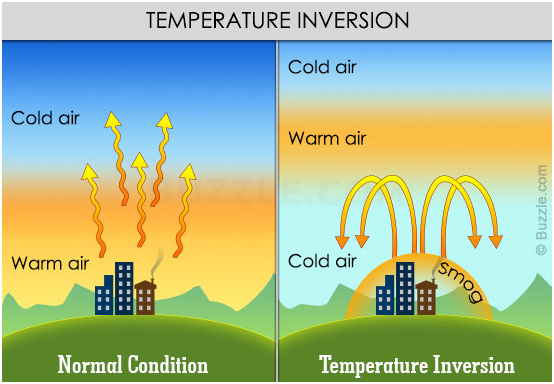
The picture coming from wikiHow http://gabynobex.uhostall.com/ubj-znal-jj-cbvagf-qb-fgenjoreevrf-unir.html
Citizens had gone through decades to find the way to control the air pollution. Los Angeles had its first smog attract during the World War II.
- In 1943, it is the first recognized smog occur in Los Angeles in the summer. The visibility is only 3 blocks, and the smog does not disappear until the plants shut down.
- In 1945, the end of World War II, Los Angeles begun its air pollution control program.
Until that point, the pollution in Los Angeles area almost reaches the worst point. Here are some pictures taken at 40s and 50s in Los Angeles.
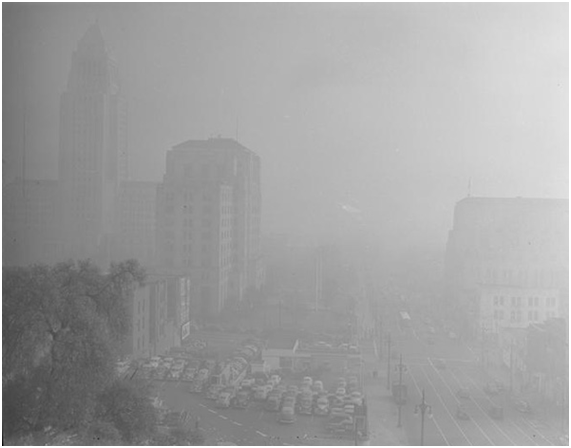
LA Civic center taken in January 6, 1948, Courtesy of UCLA Library Special Collections - Los Angeles Times Photographic Archive.

Horizontal clouds of pollution in the background taken in 1951, from the California State University Dominguez Hills Archives, have shown how inversion works in creating smog.
Pictures are coming from L.A.’s Smoggy Past, in Photo, By Nathan Masters, March 17, 2011,http://www.kcet.org/updaily/socal_focus/history/los-angeles-smoggy-past-photos-31321.html
- In 1963, Federal Clean Air Act first enacted.
- In 1969, Air Quality Standards were set by the new ARB. California became the first state in controlling the emissions of Vehicles.
- In 1970, Federal Clean Air Act Amendments of 1970 were enacted. This has established the basic program in controlling air pollution.
- In 1975, the catalytic converters being required in new cars in the U.S.. Upon this point, CA’s air pollution controlling program has entered a new chapter. The smog begun to decline.
Above data are coming from California’s Air Report Board, January 06, 2015, http://www.arb.ca.gov/html/brochure/history.htm
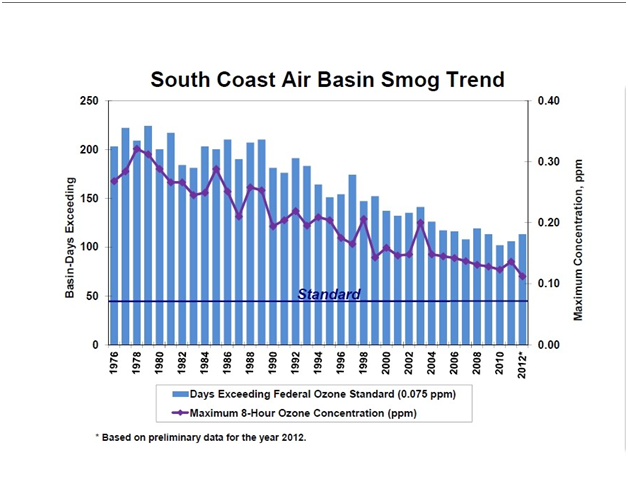
Through the South Coast Air Basin Smog Trend, established by South Coast Air Quality Management District, we clearly can see a downward trend of smog in the basin area from the year 1976, which is the second year after the requirement of catalytic converters on cars, to the year 2012. However it is still above standard.
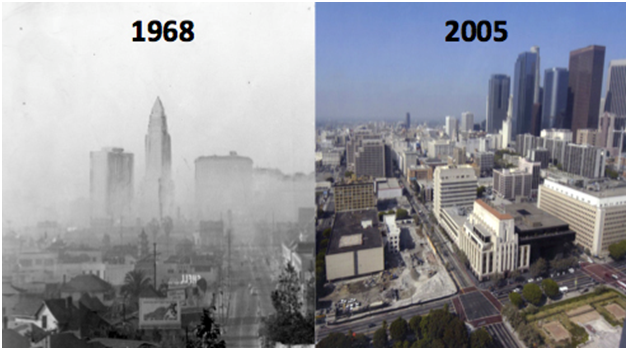
Although the smog in Los Angeles area is still upon the standard, the condition of CA’s air pollution has been improved. The picture above shows the comparison of the downtown LA in the year 1968 vs the year 2005, we can see a more clear local scenery in the recent year. Downtown Los Angeles smog photographs by the Herald-Examiner Collection (1968, left) and Gary Leonard (2005, right) courtesy of the Los Angeles Public Library (http://www.lapl.org/#photo-collection).
San Joaquin Valley
 Image by David A Grantz{http://californiaagriculture.ucanr.edu/landingpage.cfm?article=ca.v059n02p137&fulltext=yes} |
| San Joaquin Valley is one of the well known California air pollution centers; with similar geography as Los Angeles, i.e. flat valley surrounded by mountains, particulate matters produced from industry and manufacture can get trapped easily ( Grantz, 137). Because of its large growing agricultural industry, many of the particulate matters are released from vehicles used in agriculture and agriculture practices, such as burning off field. In addition, fossil fuel combustion from vehicles, power plants and other industry also contribute to the overload of particulate matter. In May 2014, a study by journal environmental science and technology stated that the increase in ozone in the atmosphere is due to animal cattle feed and animal waste and pesticides for it is one of the top dairy-producing regions in the nation (Grantz, 137).The way of animal feed releasing ozone is related to how it is being stored. These cattle feed ferments in poor oxygen environment and produces organic compounds. As a consequence, when the feed is placed outside for the animals to eat, these organic compounds are released to the atmosphere and react with other particles to form ozone. |
 Image by David A Grantz {http://californiaagriculture.ucanr.edu/landingpage.cfm?article=ca.v059n02p137&fulltext=yes} |
| Los Angeles, in the 1970s, used to have higher ozone concentration in the atmosphere than San Joaquin Valley, however as it progressed into 2005, San Joaquin Valley, with rapidly increased ozone concentration, took over Los Angeles' place as being the most polluted region in the United States. Fairbanks, Alaska  Image by Lloyd Alter {http://www.treehugger.com/environmental-policy/air-quality-fairbanks-alaska-worse-beijing.html} |
Another air polluted region in the United States is Fairbanks, Alaska. Being the most northern state of the US and surrounded by hills on three sides, it is susceptible to a condition called temperature inversion in which the temperature of the atmosphere increases with altitude (Alter, treehugger.com).Because of its snowy, freezing cold weather, a layer of cold air is trapped close to the ground. As its level of inversions intensifies, large amount of fine particulate matter gets trapped due to its increased demand of fossil fuel burning for surviving the cold weather. The largely accumulated particulate matter in Fairbanks is PM 2.5 which is defined as particulate matter with its diameter less than 2.5 micrometers that can be extremely harmful to human health.  Image from Clean Air Fairbanks {https://cleanairfairbanks.wordpress.com/category/resources/graphs-tables/}
Sources that contribute to particulate matter 2.5 accumulation are woodsmoke (72.4%), sulfate (17.3%), ammonium sulfate ( 8.4%), and autos (1.9%) (Clean Air Fairbanks, cleanairfairbanks.workpress.com).Woodsmoke source comes from wood and biomass waste burning, and industrial sources that release potassium ion and organic carbon. Sulfate is from use of coal for power generation and fuel oil in space heating that contribute to the formation of SO4 in the atmosphere. Ammonium nitrate could derive from residential wood combustion and natural gas furnaces that induce formation of NH4NO3 in the atmosphere.Autos are from use of automobiles that causes increase emission of carbon dioxide.

Here is a graph showing a record of PM2.5 concentration in downtown Fairbank from January 2006 to January 2013. The gray region is winter season in Fairbank and the red dotted horizontal line is the level of the 24 hour National Ambient Air quality standard. The peaks in 2009 and 2010 were due to wild fires smoke in Alaska.Image from State of Alaska{https://dec.alaska.gov/air/anpms/pm/pm2-5_fbks.htm}
Global Consequences from Air Pollution

Image from Robert Stewart {http://oceanworld.tamu.edu/resources/oceanography-book/co2problem.htm}
|
Global Climate Change
The excess of use of fossil fuels increases the emission of carbon dioxide, which is known as greenhouse gas, into the atmosphere. Some of heat that are supposed to reflect back into the space from earth get trapped in the atmosphere due to these greenhouse gas, making the surface of the earth getting hotter. It is predicted that by the end of the 21st century, air temperatures will increase another 4 degrees in Celsius ( Stewart, oceanworld.tamu.edu) This hot weather can affect global human and animal health by increasing the incidence of widespread infectious disease. Change in precipitation pattern could also occur, thus influencing the agriculture industry and forest ecosystems. If the agriculture is greatly affected, food variety would be limited, which could ultimately reduce the different types of nutrients consumed by human (Stewart, oceanworld.tamu.edu) The health of human is not only affected by the toxic particles that are breathed in, but also by the limited types of food that are consumed.
Sea Level Rise
Acid Deposition
The excess of use of fossil fuels increases the emission of carbon dioxide, which is known as greenhouse gas, into the atmosphere. Some of heat that are supposed to reflect back into the space from earth get trapped in the atmosphere due to these greenhouse gas, making the surface of the earth getting hotter. It is predicted that by the end of the 21st century, air temperatures will increase another 4 degrees in Celsius ( Stewart, oceanworld.tamu.edu) This hot weather can affect global human and animal health by increasing the incidence of widespread infectious disease. Change in precipitation pattern could also occur, thus influencing the agriculture industry and forest ecosystems. If the agriculture is greatly affected, food variety would be limited, which could ultimately reduce the different types of nutrients consumed by human (Stewart, oceanworld.tamu.edu) The health of human is not only affected by the toxic particles that are breathed in, but also by the limited types of food that are consumed.
Sea Level Rise
Due to the rapid rate of melting of glaciers and polar ice cap, sea level on the State's coast, which is the Pacific ocean, is already risen about seven inches from 1900-2000. It is predicted that it could rise another 10-18 inches by 2050 if the situation is not improving ( American Lung Association, lung.org)

Image from {https://optioneenvirochemblog1.wordpress.com/2012/03/28/e2-acid-deposition/}
Burning of fossil fuels release sulfur dioxide and nitrogen oxides that combine with water vapor to form sulfuric acid ad nitric acid.These acids precipitate as rain and fall into the ocean and land; as a result, aquatic ecosystems are destroyed and the forests in other parts of the world are damaged.
Eutrophication
 Image from BBC{http://www.bbc.co.uk/schools/gcsebitesize/science/edexcel/problems_in_environment/pollutionrev4.shtml} | |
| Because deposits of ammonium and nitrates could spread to other regions miles away from the source, they can get flushed into the lakes or river from land. Ammonium and nitrates are nutrients for algae growth, so excess of these would lead to algae blooms which block the sunlight from the other animals and deplete all the oxygen (BBC, bbc.co.uk).This causes the fish and other organisms to die, decreasing biodiversity in the lakes and rivers.
by 38 percent in the last fifteen years. As shown, most of the solutions are related vehicle emission (American Lung Assoication, lung.org).Therefore, it is optimistic that improvements can be seen in the future.
Organizations that target air pollution:
American Lung Association (California chapter)
It is concerned with the air quality that individuals breath in and aims to improve lung health to prevent lung disease. It released a report in 2014 called State of the Air 2014, in which both the cleanest and most polluted areas in the United States are listed (American Lung Assoication, lung.org)
The United States Environmental Protection Agency (US EPA)
It conducts research on air quality to protect human health and the environment. It enforces the Clean Air Act and the National Ambient Air Quality Standards. Air Quality System is located in EPA to store air data from various location, so air quality can get monitored. It also has a group of atmospheric modeling and analysis researchers to assess the change in air quality by creating predictive atmospheric models. (The United States Environmental Protection Agency, epa.gov)
Natural resources Defense Council (NRDC)
It proposed solutions to ameliorate LA's air pollution problem. It has examined that the communities near Ports of Los Angeles and Long Beach have 60% higher in cancer risk than other regions. It has the Clean Truck Program taken place to replace the old, polluting diesel trucks with cleaner trucks to reduce the release of particles from diesel fuel (NRDC, nrdc.org)
Effects on Human Health
The effects of Air Pollution on human health has already proven to be significant in terms of causing respiratory problems. The two most common respiratory problems are Chronic Bronchitis and emphysema (Berg page 201). The former disease is a condition in which the air passageways to the lungs have become permanently inflamed (Berg page 201). In contrast, emphysema is caused by the alveoli in the lungs losing their ability to transfer gases affecting the process of cellular respiration and leading to lots of wheezing and feelings of breathlessness (Berg page 201). Furthermore, studies have shown that male nonsmokers that lived in a city were nine times as likely to get lung cancer than their rural counterparts (Breslow). Additionally, substances taken from the air in Los Angeles have been shown to cause cancer in mice (Breslow). These Carcinogens may not show an immediate effect on the health of human beings but they do pose long term consequences to people who live in such large cities where pollution is rampant. Lastly, the effects of such toxic chemicals being breathed in daily by some individuals may even impact the our own newborn babies. Michelle Wilhelm and Beate Ritz wrote about how studies have “confirmed prior suspicions that air particulates and Carbon Monoxide have been linked to low birth weight among babies as well as an increase in preterm births”. Such health effects already start early for some children and until the quality of the air improves, more and more cases will continue to arise unless something is done.
Conclusion
Air pollution in Los Angeles has come a long way in regulating the air pollution above the city. In 2008, there were 83 fewer days that exceeded federal air quality standards than there were in 1977 (Berg page 204). Unfortunately, the total number of days exceeding air quality standards is still far higher than the normal amount of days exceeding air standards. Some people have even looked to alternate forms of fuel for cars such as ethanol in order to make biofuel and biodiesel. While this sounds like a good idea, the ability to sustain the large amount of motor vehicles in the United States alone would be impossible. All of the “(corn and soybean plants in the United States combined would only meet a mere 12 percent of our gasoline needs”) (Tilman). This would not only fail to meet the gasoline necessities but would also destroy the agriculture business and put a huge dent in the food supply. While they are more energy efficient than gasoline and less harmful on the environment, there is not enough right now to make all cars run on biofuel. Unless technology makes a huge leap forward in smog control or a new major policy is enforced, I honestly do not believe that this issue will be resolved in the near future. Eventually, I believe technology will find a way to catch up, the only question that will remain is whether or not we stop the air pollution in time.
Overarching lesson
The main lesson to take away from this presentation is that air pollution will eventually get out of control as the amount of motor vehicles and the population of Los Angeles continue to grow at a substantial rate. In order to offset the pollution and the effect on human health, emissions of pollutants must take a drastic cut in one way or another. Either a new law is put into effect that limits the amount of motor vehicles or a new clean alternate form of fuel will need to be discovered. These options would provide the most immediate way to reduce air pollution over Los Angeles. In the long term, Los Angeles will only improve once the emissions have been reduced one way or another.
Works Cited:
Berg, Linda R., and Mary Catherine Hager. "Air and Air Pollution." Visualizing Environmental Science. 4th ed. Hoboken, NJ: Wiley, 2011. Print.Breslow, Lester, and John
Goldsmith. "Health Effects of Air Pollution." American Journal of Public Health and the Nations Health: 913-17. Print.
Michelle Wilhelm and Beate Ritz, Environmental Health PerspectivesVol. 113, No. 9 (Sep., 2005), pp. 1212-1221
"California Pollution Map: LA Has 3 of the Most Polluted ZIP Codes." Southern California Public Radio. 23 Apr. 2013. Web. 5 Mar. 2015.
Davis, Mike. Ecology of Fear: Los Angeles and the Imagination of Disaster. New York: Metropolitan, 1998. 19. Print
Air Non-point Mobile Source. (2011). Retrieved from State of Alaska: Division of Air Quality: https://dec.alaska.gov/air/anpms/pm/pm2-5_fbks.htm
Bernabe, Maria. (2014). American Lung Association Releases 2014 Report on Air Quality for California Cities and Counties. Los Angeles: American Lung Association In California.
Bhanoo, S. N. (2010, April 26). Smog in a Rural Valley? Mystery Is Solved. Retrieved from The New York Times: 2010
(2009). Global Warming: Impacts to Public Health and Air Quality. American Lung Association.
Jones, Enesta. (2014, November 11). Retrieved from United States Environmental Protection Agency: http://yosemite.epa.gov/opa/admpress.nsf/bd4379a92ceceeac8525735900400c27/6ce92be958c8149285257d9c0049562e!OpenDocument
Nasr, E. (n.d.). Minimize Traffic and Air Pollution in Los Angeles. Retrieved from Petition To Change Your World: http://forcechange.com/25533/minimize-traffic-and-air-pollution-in-los-angeles/
Nathanson, J. A. (2013, October 14). Encyclopaedia Britannica. Retrieved from Air pollution:
Natural Resources Defense Council. (2012, February 22). Retrieved from Cleaning Up Southern California's Air: http://www.nrdc.org/air/diesel-exhaust/california-air-quality.asp
Option E: Environmental Chemistry Group. (2012, March 28). Retrieved from E2 Acid Deposition: https://optioneenvirochemblog1.wordpress.com/2012/03/28/e2-acid-deposition/
Pettit, D. (2014, May 2). Why is California 'worst'? Retrieved from CNN: http://www.cnn.com/2014/05/02/opinion/pettit-california-pollution/
Pollution: Eutrophication. (2014). Retrieved from BBC.
Stewart, R. (2009, February 2). The Carbon Dioxide( CO2) Problem. Retrieved from Our Ocean Planet:
Tilman, David. "Environmental, Economic, and Energetic Costs and Benefits of Biodiesel and Ethanol Biofuels."Environmental, Economic, and Energetic Costs and Benefits of Biodiesel and Ethanol Biofuels. Web. 5 Mar. 2015. <http://www.pnas.org/content/103/30/11206.s
http://oceanworld.tamu.edu/resources/oceanography-book/co2problem.htm
Trees- an Innovative Solution to Air Pollution. (n.d.). Retrieved from California Urban Forests Council: http://www.caufc.org/Trees%20and%20Air%20Quality%20w%20resources.pdf
United States Environmental Protection Agency. (2014, November 5). Retrieved from Atmospheric Modeling & Analysis Research: http://www.epa.gov/asmdnerl/index.html
Grantz, D. A. (2005). Ozone reduces crop yields and alters competition with weeds such as yellow nutsedge. California Agriculture 59(2), 137-143.
Nusca, A. (2011, June 17). Plan for Los Angeles aims to expand transit, cut pollution. Retrieved from ZDNet: http://www.zdnet.com/article/plan-for-los-angeles-aims-to-expand-transit-cut-pollution/
Gardner, Sarah. "LA Smog: The Battle against Air Pollution." LA Smog: The Battle against Air Pollution. Marketplace, 14 July 2014. Web. 5 Mar. 2015. <http://www.marketplace.org/topics/sustainability/we-used-be-china/la-smog-battle-against-air-pollution>.
"Key Events in the History of Air Quality in California." Key Events in the History or Air Quality in California. CA's Air Resources Board, 6 Jan. 2015. Web. 5 Mar. 2015. <http://www.arb.ca.gov/html/brochure/history.>
"Pollution Burdens." Graphics.latimes.com. Los Angeles Time, 25 Apr. 2014. Web. 5 Mar. 2015. <http://graphics.latimes.com/responsivemap-pollution-burdens/>.
Master, Nathan. "L.A.'s Smoggy Past, in Photos." KCET. 17 Mar. 2011. Web. 5 Mar. 2015. <http://www.kcet.org/updaily/socal_focus/history/los-angeles-smoggy-past-photos-31321.html>.
"South Coast Air Basin Smog Trend." South Coast Air Quality Management District. Web. 5 Mar. 2015. <http://www.aqmd.gov/docs/default-source/air-quality/historical-data-by-year/ozone-trend-chart-from-historical-data-by-year.pdf>.
"Los Angeles Air Pollution Declining, Losing Its Sting." Cooperative Institute for Research in Environmental Sciences ::. 4 June 2013. Web. 5 Mar. 2015. <http://cires.colorado.edu/news/press/los-angeles-air-pollution-declining-losing-its-sting/>.
|